Graphing for Kids: Build Visual Math Skills by Grade
Your child brings home a worksheet full of bar graphs and line plots, and suddenly dinner turns into a tutoring session. If that sounds familiar, you’re not alone. Graphing is one of those math skills that looks simple on paper but trips kids up more than you’d expect. The good news? Once children learn to read and create graphs, they unlock a way of thinking about numbers that carries them through middle school, science class, and beyond. This guide breaks down exactly how to teach graphing for kids at every level, with practical activities you can try tonight.
📺 Video Guide
Why Graphs Matter More Than You Think
Graphs aren’t just a math topic. They show up in science reports, news articles, social studies projects, and even video game stats. When a child can look at a bar chart and immediately understand what the tallest bar means, or trace a line graph to spot a trend, they’re building data literacy, a skill the National Council of Teachers of Mathematics (NCTM) considers foundational from kindergarten onward.
Research from the Institute of Education Sciences shows that students who work with visual representations of data perform better on problem-solving tasks. That makes sense. A graph takes abstract numbers and turns them into something you can see, compare, and talk about.
For parents, this means graphing for kids isn’t just another box to check on a homework sheet. It’s one of the most transferable skills your child will learn in elementary math.
Types of Graphs Kids Need to Know
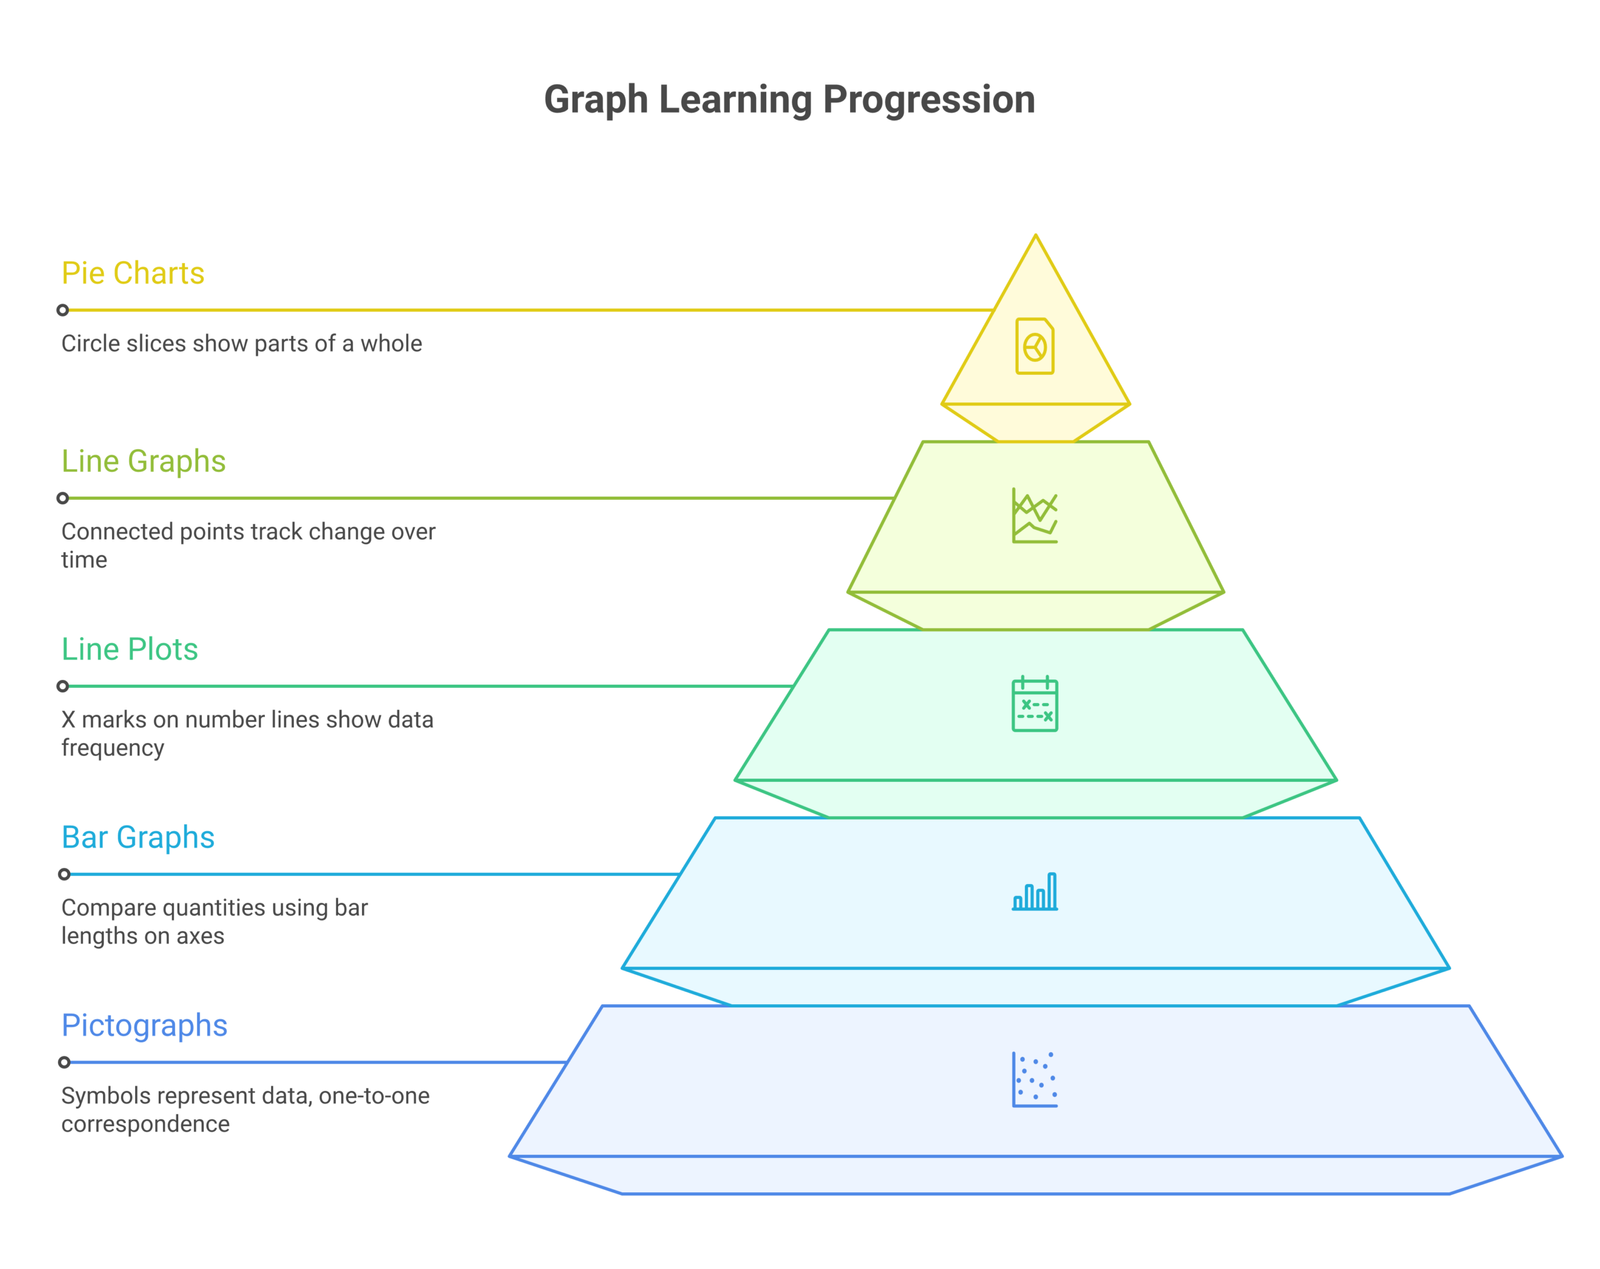
Different grade levels introduce different graph types. Here’s a practical breakdown of what your child will encounter and when.
Pictographs (Grades K-2): These use small pictures or symbols to represent data. Each symbol stands for one item, or sometimes two or five. Kids love these because they’re visual and concrete. A pictograph showing “How many pets do classmates have?” with little dog and cat icons clicks instantly.
Bar graphs (Grades 1-3): Bars represent quantities using length. Kids learn to read the axes, compare bar heights, and answer questions like “Which has the most?” and “How many more does X have than Y?” According to the Common Core State Standards, second graders should be able to draw bar graphs and use them to solve addition and subtraction problems.
Line plots (Grades 2-5): A number line with X marks above each value showing frequency. These show up when kids measure things, like the lengths of pencils in a desk or shoe sizes in a class. Line plots are the gateway to understanding distribution.
Line graphs (Grades 4-5): Points connected by lines show change over time. Temperature across a week, plant growth in centimeters, money saved each month. Line graphs help kids see trends and make predictions.
Pie charts (Grades 4-6): Circles divided into slices representing parts of a whole. These connect graphing to fractions and percentages, two other areas where visual thinking pays off.
💡 Quick reference
If your child is in Grades 1-2, focus on pictographs and bar graphs. Grades 3-4, add line plots. Grades 5-6, introduce line graphs and pie charts. Don’t rush ahead. Mastering simple graphs first makes the harder ones much easier.
How to Teach Graphing at Home (5 Practical Activities)
Worksheets have their place, but the best way to teach graphing is to let kids collect and graph their own data. That’s where the learning actually sticks. Here are five activities that work.
1. The Snack Survey
Give your child a handful of mixed snacks (goldfish, pretzels, raisins, cereal pieces). Have them sort by type, count each group, and draw a bar graph. They get to eat the data when they’re done. Motivation is built in.
2. Weather Tracker
Set up a simple chart on the fridge. Every morning for a week, your child records the temperature outside (you can use a weather.gov app if you don’t have a thermometer). At the end of the week, they plot a line graph. This teaches both data collection and trend reading.
3. Family Favorites Poll
Your child polls family members (or friends, or stuffed animals for younger kids) about a favorite: pizza topping, color, superhero, TV show. They tally the results and create a pictograph. Even five-year-olds can do this with stickers on paper.
4. Plant Growth Journal
Plant a bean seed in a cup. Every three days, your child measures the sprout in centimeters and records it. After two weeks, they have enough data points for a real line graph. Science and math in one activity.
5. Screen Time Pie Chart
For older kids (Grades 4-6), track how they spend an hour of free time across a few days. Categories might be: gaming, YouTube, reading, outside play. Convert the totals to a pie chart. It’s a sneaky way to open a conversation about balance while practicing graphing for kids in a way that feels relevant to them.
Reading Graphs: The Skills That Trip Kids Up
Making graphs is one thing. Reading them accurately is another. Teachers report that students commonly stumble on a few specific points, according to a study published in the Journal for Research in Mathematics Education.
Ignoring the scale. A bar graph where each line represents 5 instead of 1 confuses kids who count grid lines literally. Practice with different scales (by 2s, 5s, 10s) to build this awareness.
Confusing axes. Which axis shows the category and which shows the amount? Vertical and horizontal bar graphs switch these, and kids mix them up. Label them explicitly every time, and have your child say out loud what each axis represents before answering questions.
Reading between values. When a bar lands between two grid lines, kids need to estimate. This is a form of number sense that doesn’t come naturally. Point to in-between values and ask, “Is this closer to 15 or 20?” Regular practice builds this instinct.
Missing the question. Many graphing problems ask comparison questions: “How many more students chose pizza than tacos?” Kids who read the graph correctly still get the answer wrong because they give individual values instead of the difference. Teach your child to underline the question before looking at the graph.
✓ Parent checklist for graph reading
- ✓ Can your child identify the title of a graph?
- ✓ Can they explain what each axis shows?
- ✓ Can they read values when the scale goes by 2s, 5s, or 10s?
- ✓ Can they answer “how many more” comparison questions?
- ✓ Can they spot trends in a line graph (going up, going down, staying flat)?
Digital Tools That Make Graphing Click
Paper and pencil graphing matters, but digital tools can speed up the feedback loop and keep kids engaged. Here are a few worth trying.
NCES Kids’ Zone Create a Graph is a free tool from the U.S. Department of Education. Kids enter data and choose from bar, line, area, or pie chart options. It generates a clean graph instantly, which helps kids connect raw data to visual output without getting bogged down in drawing precision.
Math Learning Center apps offer free virtual manipulatives including graphing tools designed for elementary students. They’re used in classrooms across the U.S. and work on tablets and computers.
For practice worksheets tailored to your child’s grade level, MathSpark generates AI-powered math worksheets in about 10 seconds, covering the curriculum for Grades 1-9. If your child needs extra reps on reading or creating specific graph types, you can generate targeted practice sheets without spending an hour searching for the right PDF online.
Desmos is better suited for older students (Grade 5+), but it’s free and incredibly powerful. Kids can plot points, see graphs form in real time, and experiment with how changing data changes the graph. It bridges the gap between elementary graphing and the coordinate graphing they’ll encounter in middle school.
Graphing by Grade Level: What to Expect
Knowing what your child’s grade expects helps you support them without pushing too far ahead or accidentally skipping basics.
Kindergarten and Grade 1: Sorting objects into categories and counting. Simple pictographs with one-to-one correspondence. “We have 4 red apples and 6 green apples.” The Common Core standards for Grade 1 expect kids to organize data into up to three categories.
Grade 2: Bar graphs and picture graphs with single-unit scales. Kids draw their own graphs from data tables and answer questions. This is where “how many more” and “how many fewer” questions start appearing.
Grade 3: Scaled bar graphs (where each square or unit represents more than one). Line plots using halves and fourths on a number line. Data sets get bigger, and kids need to extract specific information from more complex displays.
Grade 4: Line plots with fractions (halves, quarters, eighths). Kids begin interpreting line graphs showing change over time. They also start connecting graphing to measurement, plotting data they’ve collected from science experiments.
Grades 5-6: Coordinate graphing on the first quadrant (x,y axes). Pie charts and percentages. Multiple data sets on one graph for comparison. At this point, graphing overlaps with fractions, decimals, and basic statistics. The NCTM recommends that by Grade 6, students should be able to describe the shape and spread of a data distribution.
Common Mistakes Parents Make When Teaching Graphs
With the best intentions, parents sometimes create extra confusion. Watch for these patterns.
Skipping the “why.” If kids don’t understand why we graph data in the first place, the whole exercise feels pointless. Before jumping into how to draw a bar graph, ask: “If I gave you a list of 20 numbers, would it be easy to see which is biggest? What if I showed you a picture instead?” Let them feel the problem before handing them the solution.
Correcting too fast. When your child mislabels an axis or picks the wrong scale, resist the urge to fix it immediately. Ask, “Does your graph look right to you? What do you notice?” according to Khan Academy’s recommendations for building math reasoning. Self-correction builds deeper understanding than parent-correction.
Only using textbook data. The data in worksheets is fine for practice. But kids engage more when the data is theirs. How many goals did they score in each soccer game this season? How many pages did they read each day this week? Personal data makes abstract skills concrete.
Jumping to complex graphs too early. A child who can’t reliably read a bar graph shouldn’t be working on line graphs yet. Each type builds on the one before. Rushing ahead creates gaps that show up later as frustration and avoidance, a pattern that researchers at the American Psychological Association link to math anxiety in older students.
📝 A note about perfection
Your child’s first graphs will look messy. The bars might be uneven, the labels might be crooked, and the scale might not make sense. That’s fine. Graphing is a skill that improves with repetition, not with one perfect attempt. Celebrate the effort, then gently guide improvements next time.
Connecting Graphs to Other Math Skills
Graphing doesn’t live in isolation. It connects to nearly every other math topic your child is learning, and making those connections explicit helps them retain both skills.
Addition and subtraction: “How many more students chose blue than red?” is a subtraction problem disguised as a graph question. Work through the graph visually first, then write the equation.
Multiplication: Scaled graphs where each symbol represents 2 or 5 are multiplication in action. “If each picture equals 5 votes, and there are 4 pictures, how many votes total?” That’s 5 x 4 = 20.
Fractions and percentages: Pie charts are fraction circles with a practical purpose. A child who can look at a pie chart and say “about one quarter of students chose soccer” is applying fraction knowledge to data interpretation.
Measurement: Line graphs often plot measured quantities. Height in centimeters, temperature in degrees, time in minutes. Graphing reinforces measurement units and the idea that numbers represent real things you can observe.
Frequently Asked Questions
At what age should kids start learning about graphs?
Most curricula introduce simple sorting and counting (the foundation for graphing) in kindergarten, around age 5. By first grade, kids work with basic pictographs. There’s no need to start formal graphing earlier, but sorting objects by color or size with a toddler is a natural precursor.
My child can draw graphs but struggles to read them. What should I do?
This is common. Start by having your child describe the graph in words before answering any questions: “What is this graph about? What does the tallest bar show? What does the shortest bar show?” Verbalizing forces them to process the visual information. Then move to specific questions. Practice with graphs that have clear, simple data before introducing tricky scales or comparison questions.
How does graphing connect to later math courses?
Graphing leads directly into coordinate geometry (plotting points on x,y axes), algebra (graphing equations), and statistics (analyzing data distributions). A student who is comfortable reading and creating elementary graphs transitions to these topics much more smoothly. In middle and high school, graphing becomes a daily tool rather than a standalone topic.
Are there any free resources for graphing practice?
Yes. The NCES Kids’ Zone has a free graph creator tool. MathSpark generates targeted math worksheets covering graphing skills by grade. Khan Academy offers free video lessons and practice exercises on data and graphing for every elementary grade.
Should I use graph paper or plain paper?
Graph paper is better for beginners. The grid lines help kids keep bars even and scales consistent. Once they’re comfortable with the concepts, plain paper is fine. You can print free graph paper from sites like Math is Fun.
⚠️ Disclaimer
This article is for informational purposes. Educational standards vary by region and curriculum. The grade-level guidelines referenced here are based on U.S. Common Core standards as of March 2026. Check with your child’s school for specific expectations in your area.