Math for Visual Learners: Strategies That Work

If your child understands a problem faster when they can see it, draw it, or color-code it, this guide on math for visual learners is for you. Some children freeze when math is explained only with words, then relax the moment you sketch a number line, build an array, or show a bar model. That does not mean they are “bad at math.” It usually means they need the idea to become visible before it becomes comfortable.
Good math teaching already leans on visuals. The National Council of Teachers of Mathematics, CAST, and classroom resources from Khan Academy all use diagrams, models, and multiple representations because they help children connect abstract symbols to something concrete. At home, parents can do the same thing without turning every homework session into a battle.
📺 Video guide
What visual learning looks like in math
A visual learner in math usually makes sense of ideas through pictures, layouts, patterns, and spatial relationships. You might notice your child drawing dots for multiplication, lining up objects to compare quantities, or remembering a geometry fact because they can “see” the shape in their head. Research-informed classroom practice from The IRIS Center and guidance shared by NWEA both stress that representations matter, especially when students are moving from concrete tools to symbols.
That said, labels can become a trap. Some articles online talk about learning styles as if one label explains everything. Understood and other child-development resources make a useful distinction here: even if “visual learner” is not a complete scientific category, many children still benefit from visual supports. In practice, that is what parents should focus on. If visual explanations reduce stress and improve accuracy, use them.
Visual support is especially helpful when a child loses track of multi-step problems, struggles to picture place value, or feels overwhelmed by a page of numbers. A cleaner layout, a quick sketch, or a color-coded example can lower the mental load enough for real learning to begin.
✓ Signs your child may benefit from visual math support
- ✓ They understand faster when you draw the problem.
- ✓ They notice patterns, shapes, and number layouts quickly.
- ✓ They lose their place during verbal explanations.
- ✓ They do better with charts, number lines, arrays, or graph paper.
Why visuals help numbers make sense
Math gets hard when children are asked to manipulate symbols before those symbols mean something. A child may know that 3/4 is written with two numbers and a line, but still not feel what the fraction represents. Visual models fix that. A shaded rectangle, fraction strip, or pizza drawing turns an abstract symbol into a relationship the child can inspect.
This is one reason frameworks like Universal Design for Learning recommend giving learners more than one way to access content. The same idea appears in resources from Edutopia, the Education Endowment Foundation, and Scholastic Parents: children understand more when they can talk about a concept, see it, and use it.
For parents, the takeaway is simple. If your child cannot explain an answer, do not repeat the same sentence louder. Make the idea visible. Draw groups. Circle equal parts. Use color to mark steps. Show the same problem in two forms. That tiny shift often changes the whole mood of homework time.
💡 Pro tip
When your child gets stuck, ask “Can we draw it?” before you ask “What is the answer?” The drawing often reveals where the confusion starts.
Seven visual strategies that actually help
Parents do not need a cabinet full of expensive materials to make math for visual learners work. The goal is not to decorate the lesson. The goal is to reveal structure. These seven strategies do that well.
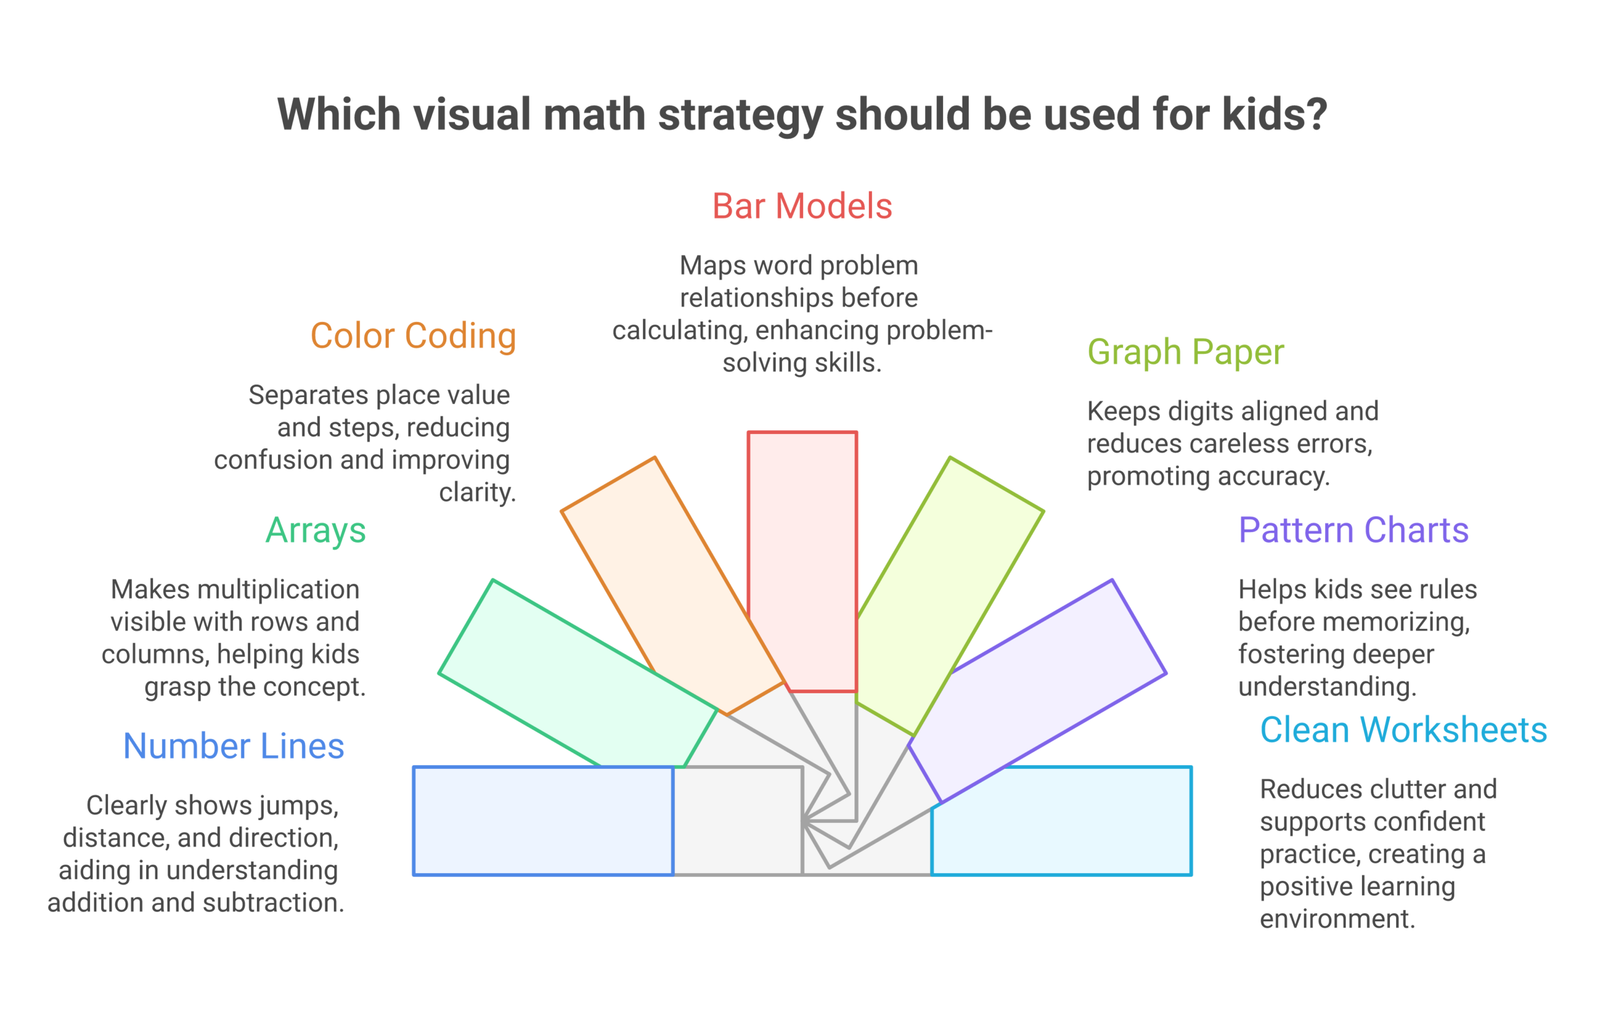
1. Use number lines early and often. Number lines help with counting, subtraction, negative numbers, rounding, fractions, and simple algebra. If your child struggles with jumps and intervals, revisit ideas from our guide on negative numbers for kids and practice with marked jumps in different colors.
2. Turn multiplication into arrays. Rows and columns make multiplication visible. Instead of memorizing 4 × 6 as a fact floating in space, a child can see four rows of six. That same picture later supports area models and algebra tiles.
3. Color-code steps, not everything. A different color for each place value column or each operation can reduce confusion. Too many colors create noise, so keep the system simple. One color for the operation, one for regrouping, one for the final answer is enough.
4. Sketch bar models for word problems. A bar model helps children see the relationships inside the sentence before they compute. This pairs nicely with our article on problem solving strategies for kids, especially for compare, part-whole, and multi-step problems.
5. Use graph paper for alignment. Many errors in subtraction, regrouping, and long multiplication happen because the page is messy, not because the child does not understand. Graph paper keeps digits lined up and lowers frustration. If regrouping is still shaky, pair this with teaching subtraction with regrouping.
6. Show patterns before rules. Visual learners often trust a rule more when they can see the pattern that led to it. Skip counting charts, hundreds charts, and pattern blocks do this beautifully. Our post on pattern recognition is a good place to keep building that habit.
7. Use clean worksheets with visual cues. This is where a tool like MathSpark can help. If your child needs practice without a cluttered page, you can generate grade-appropriate worksheets in seconds, adjust the difficulty, and give them a layout that feels clear instead of intimidating. For many families, that is the difference between practice that gets done and practice that ends in tears.
📝 Important note
Visual support should make math clearer, not busier. If the page starts looking like a craft project, strip it back. One diagram and one clear next step usually beat five decorations.
Best tools to keep at home
You do not need to buy everything. A small set of reliable tools goes a long way. Printed number lines, graph paper, blank grids, sticky notes, colored pencils, coins, dice, and a whiteboard cover a surprising amount of ground. For geometry and data, simple charts work well. If your child enjoys visuals, our guide on graphing for kids gives you another easy entry point.
Digital tools can also help, but choose them carefully. Resources from PBS Parents, Oxford Owl, and Child Mind Institute all point toward the same idea: children do better when the tool supports the concept instead of distracting from it. A clean interface beats an over-animated app every time.
If you are choosing worksheets, prioritize spacing, readability, and one clear objective per page. That is why many parents prefer short targeted sets over giant mixed packets. One focused visual win today is worth more than ten rushed pages that leave your child discouraged.
Mistakes parents make with visual learners
The first mistake is assuming visuals are only for younger children. Older students need them too. Fractions, ratios, algebra, and statistics all become easier when students can map relationships instead of memorizing procedures in the dark.
The second mistake is rushing to tricks. Visual learners do not just want a shortcut. They want to see why the shortcut works. If you teach an algorithm without the picture behind it, your child may imitate the steps today and forget them tomorrow.
The third mistake is overexplaining. Parents sometimes keep talking when the child really needs ten quiet seconds to inspect the diagram. After you draw the model, pause. Let your child point, label, and narrate what they notice.
The last mistake is treating neat work as a personality issue instead of a support issue. Messy setup creates wrong answers. A better layout, clearer spacing, and visible steps can fix what looks like carelessness.
⚠️ Disclaimer
This article is educational information, not a diagnosis. Learning differences show up in many ways, and a child who benefits from visual math support may also need verbal, hands-on, or specialist support. References in this article are current as of April 2026.
A simple by-grade approach
Grades 1-2: Focus on ten frames, dot cards, number bonds, shapes, and physical objects arranged in clear patterns. Keep instructions short and let the picture do most of the teaching.
Grades 3-4: Add arrays, area models, bar models, and graph paper. This is a great stage for building fluency without losing understanding.
Grades 5-6: Use fraction strips, ratio tables, coordinate grids, and color-coded worked examples. Encourage students to sketch before solving.
Middle school and beyond: Keep using diagrams for equations, percentages, proportions, and data. Visual math is not babyish. It is efficient. Adults use spreadsheets, dashboards, and graphs for the same reason: seeing structure helps us think.
The goal is confidence, not perfect notes
Parents sometimes worry that using visuals is a crutch. Usually it is the opposite. Visuals are the bridge that lets a child move from confusion to understanding. Once the meaning is secure, many students rely on the picture less because they have built the concept properly.
So if your child learns math best by seeing it, lean into that. Draw more. Talk less. Keep the page clean. Use representations that reveal the structure of the problem. And when you need quick, uncluttered practice, use tools that respect the way your child learns instead of piling on more noise.
That is the real promise of math for visual learners. Not a trendy label. Just a calmer path to understanding.
Frequently asked questions
What is the best math tool for visual learners?
The best tool depends on the concept. Number lines, arrays, graph paper, bar models, and clean worksheets all help. Start with the tool that makes the specific problem visible.
Do visual learners need different math content?
Usually no. They need the same core content explained with clearer representations, better layout, and more visible steps.
Can worksheets help visual learners?
Yes, if the worksheet is clean, well spaced, and focused on one skill at a time. Crowded worksheets often make learning harder, even when the math level is right.
Should older kids still draw math models?
Absolutely. Older students use visual models for fractions, algebra, ratios, geometry, and statistics. Drawing the structure is a smart strategy, not a childish one.
How can I make homework less stressful for a visual learner?
Reduce clutter, use graph paper or a whiteboard, ask your child to sketch the problem, and give short practice sets instead of long mixed pages.